Covid-19 Consensus Analysis
Patryk Bronka, Diego Collado, Matteo Richiardi
2 May 2020
Introduction
On the 23rd of March 2020, the UK Government issued an emergency regulation to contain the spread of Covid-19. The implemented lock-down measures included restrictions on movement and requirement to close premises and businesses during the emergency. Such measures will likely have a significant negative impact on the economy, with current forecasts predicting a 10 to 35% decrease in the second quarter GDP. We aim to estimate the effects of the lock-down measures on the disposable income of households using a tax-benefit microsimulation model, which applies fiscal rules to input (typically survey) data. However, there is a lack of updated data on sectoral activity and employment. To circumvent this, we conducted a consensus analysis of the opinions of established economists affiliated with the UK institutions. This page describes the questionnaire in more detail and presents summary statistics.
Questionnaire
To maximise the number of responses obtained, we set up a short, anonymous survey with 3 questions using the Qualtrics platform. The survey has been distributed to 2644 researchers on the 24th of April. By closing date on the 1st of May, we recorded 378 answers, giving the response rate of 14.3%. Removing surveys in which no questions were answered and surveys in which respondents did not consent to the study, we obtain a sample of 257 responses with 81% of complete responses (208 completed surveys and 49 partially completed surveys).
In all the questions respondents were asked to adjust sliders to indicate what % change they expect the lock-down measures to have on different sectors of the economy.
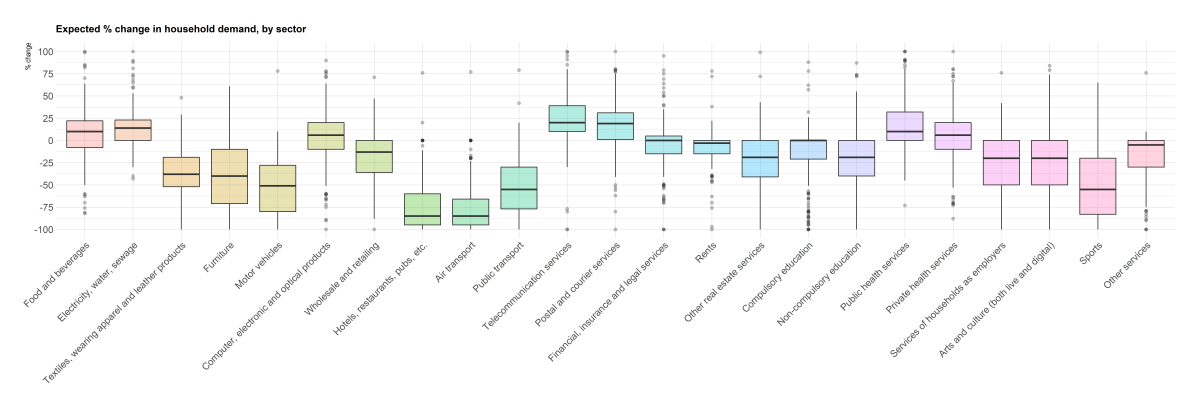
Question 1: Household final demand
Please adjust the sliders in the table below to your estimates of the effects on Final household demand for goods and services: this is due to constraints preventing consumers from physically visiting sellers. If you are unsure, please provide your best guesstimate. It is not required to have specific prior knowledge to answer these questions.
In the first question, respondents were asked to indicate what % change they expect in the final demand of households for the goods or services of the 23 sectors listed in the first column of the table below. Below we report the summary statistics as well as boxplots. Respondents expect largest negative changes to occur in hospitality, transport good and services, and sports. On the other hand, on average, the household demand for telecommunication services, postal services, and utilities is predicted to increase by approximately 20%.
| Sector |
Median |
Mean |
SD |
Minimum |
Maximum |
25th percentile |
75th percentile |
| Food and beverages |
10 |
8.05 |
28.2 |
-82 |
100 |
-8 |
22 |
| Electricity, water, sewage |
14 |
15.50 |
20.4 |
-43 |
100 |
0 |
23 |
| Textiles, wearing apparel and leather products |
-38 |
-37.38 |
24.8 |
-100 |
48 |
-52 |
-19 |
| Furniture |
-40 |
-39.72 |
34.4 |
-100 |
61 |
-71 |
-10 |
| Motor vehicles |
-51 |
-50.86 |
31.6 |
-100 |
78 |
-80 |
-28 |
| Computer, electronic and optical products |
6 |
3.71 |
29.7 |
-100 |
90 |
-10 |
20 |
| Wholesale and retailing |
-13 |
-18.89 |
28.3 |
-100 |
71 |
-36 |
0 |
| Hotels, restaurants, pubs, etc. |
-85 |
-73.68 |
29.1 |
-100 |
76 |
-95 |
-60 |
| Air transport |
-85 |
-75.40 |
28.2 |
-100 |
77 |
-95 |
-66 |
| Public transport |
-55 |
-53.11 |
30.5 |
-100 |
79 |
-77 |
-30 |
| Telecommunication services |
20 |
23.35 |
27.3 |
-100 |
100 |
10 |
39 |
| Postal and courier services |
19 |
17.57 |
26.0 |
-100 |
100 |
1 |
31 |
| Financial, insurance and legal services |
0 |
-4.30 |
25.5 |
-100 |
95 |
-15 |
5 |
| Rents |
-3 |
-8.37 |
17.8 |
-100 |
78 |
-15 |
0 |
| Other real estate services |
-19 |
-24.84 |
30.3 |
-100 |
99 |
-41 |
0 |
| Compulsory education |
0 |
-15.84 |
31.2 |
-100 |
88 |
-21 |
0 |
| Non-compulsory education |
-19 |
-21.17 |
32.2 |
-100 |
87 |
-40 |
0 |
| Public health services |
10 |
15.53 |
31.9 |
-73 |
100 |
0 |
32 |
| Private health services |
6 |
4.20 |
30.3 |
-88 |
100 |
-10 |
20 |
| Services of households as employers |
-20 |
-25.86 |
33.0 |
-100 |
76 |
-50 |
0 |
| Arts and culture (both live and digital) |
-20 |
-22.16 |
37.5 |
-100 |
84 |
-50 |
0 |
| Sports |
-55 |
-50.53 |
37.9 |
-100 |
65 |
-83 |
-20 |
| Other services |
-5 |
-17.85 |
25.3 |
-100 |
76 |
-30 |
0 |
| Note: Statistics based on 257 valid responses to this question. |
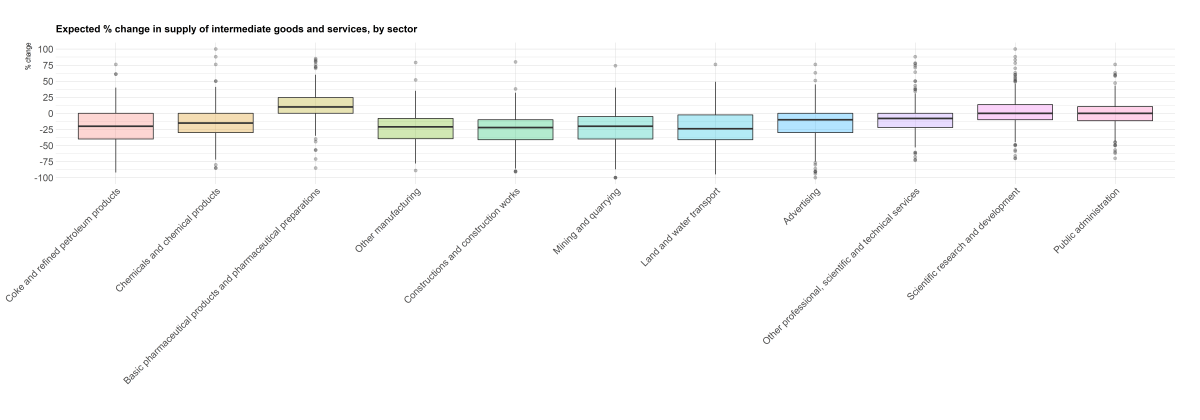
Question 2: Supply of intermediate goods and services to businesses
Please adjust the sliders in the table below to your estimates of the effects on Supply of intermediate goods and services to businesses: this is due to social distancing and smart working measures reducing the output of intermediate goods and services, which producers sell to other producers. If you are unsure, please provide your best guesstimate. It is not required to have specific prior knowledge to answer these questions.
In the second question, respondents were asked to indicate what % change they expect in the supply of intermediate goods and services to businesses in the 11 sectors listed in the first column of the table below. Below we report the summary statistics as well as boxplots. Supply of intermediate goods in all sectors, except for basic pharmaceutical products and preparations, is expected to decline by 10-25%.
| Sector |
Median |
Mean |
SD |
Minimum |
Maximum |
25th percentile |
75th percentile |
| Coke and refined petroleum products |
-20 |
-23.46 |
28.4 |
-92 |
76 |
-40.0 |
0.0 |
| Chemicals and chemical products |
-15 |
-14.04 |
26.7 |
-85 |
100 |
-30.0 |
0.0 |
| Basic pharmaceutical products and pharmaceutical preparations |
10 |
11.65 |
25.7 |
-85 |
85 |
0.0 |
24.5 |
| Other manufacturing |
-21 |
-23.87 |
23.4 |
-89 |
79 |
-39.5 |
-8.0 |
| Constructions and construction works |
-22 |
-27.15 |
25.3 |
-91 |
80 |
-41.0 |
-10.0 |
| Mining and quarrying |
-20 |
-25.17 |
26.7 |
-100 |
74 |
-40.0 |
-5.0 |
| Land and water transport |
-24 |
-26.36 |
28.9 |
-95 |
76 |
-41.0 |
-2.5 |
| Advertising |
-10 |
-14.76 |
27.2 |
-100 |
76 |
-30.0 |
0.0 |
| Other professional, scientific and technical services |
-8 |
-6.98 |
25.2 |
-73 |
88 |
-22.0 |
0.0 |
| Scientific research and development |
0 |
3.38 |
25.6 |
-70 |
100 |
-10.0 |
13.5 |
| Public administration |
0 |
-1.04 |
23.1 |
-70 |
76 |
-11.5 |
10.5 |
| Note: Statistics based on 223 valid responses to this question. |

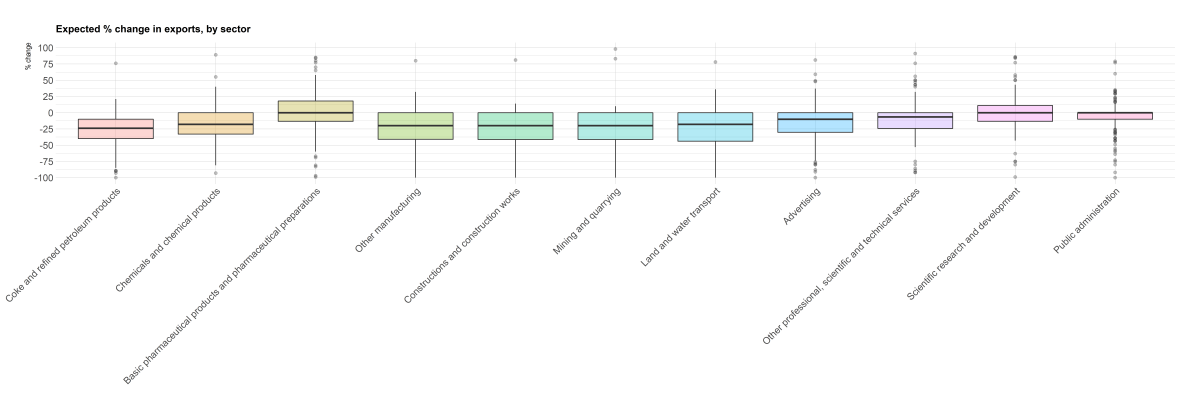
Question 3: Export of intermediate and final goods
Please adjust the sliders in the table below to your estimates of the effects on Export of intermediate and final goods: this is due to reduction in the demand from importers, or to difficulties to get the goods and services through the border. If you are unsure, please provide your best guesstimate. It is not required to have specific prior knowledge to answer these questions.
In the third question, respondents were asked to indicate what % change they expect in the export of intermediate and final goods in the 11 sectors listed in the first column of the table below. Below we report the summary statistics as well as boxplots. The expected effect of the lock-down measures on export of intermediate and final goods is non-positive for all sectors. Export of coke and refined petroleum products is expected to decrease the most, by 24%.
| Sector |
Median |
Mean |
SD |
Minimum |
Maximum |
25th percentile |
75th percentile |
| Coke and refined petroleum products |
-24.0 |
-27.072 |
25.1 |
-100 |
76 |
-40.0 |
-10 |
| Chemicals and chemical products |
-18.0 |
-17.808 |
24.6 |
-93 |
89 |
-33.0 |
0 |
| Basic pharmaceutical products and pharmaceutical preparations |
0.0 |
0.899 |
30.2 |
-99 |
85 |
-13.2 |
18 |
| Other manufacturing |
-20.0 |
-24.351 |
25.4 |
-100 |
80 |
-41.0 |
0 |
| Constructions and construction works |
-20.0 |
-25.192 |
26.8 |
-100 |
81 |
-41.2 |
0 |
| Mining and quarrying |
-20.0 |
-24.178 |
26.2 |
-100 |
98 |
-41.2 |
0 |
| Land and water transport |
-18.0 |
-24.870 |
30.0 |
-100 |
78 |
-44.0 |
0 |
| Advertising |
-10.0 |
-15.942 |
26.2 |
-100 |
81 |
-30.2 |
0 |
| Other professional, scientific and technical services |
-6.5 |
-9.370 |
26.0 |
-92 |
91 |
-24.2 |
0 |
| Scientific research and development |
0.0 |
-0.577 |
25.0 |
-99 |
86 |
-13.2 |
11 |
| Public administration |
0.0 |
-5.303 |
22.2 |
-100 |
79 |
-10.0 |
0 |
| Note: Statistics based on 208 valid responses to this question. |